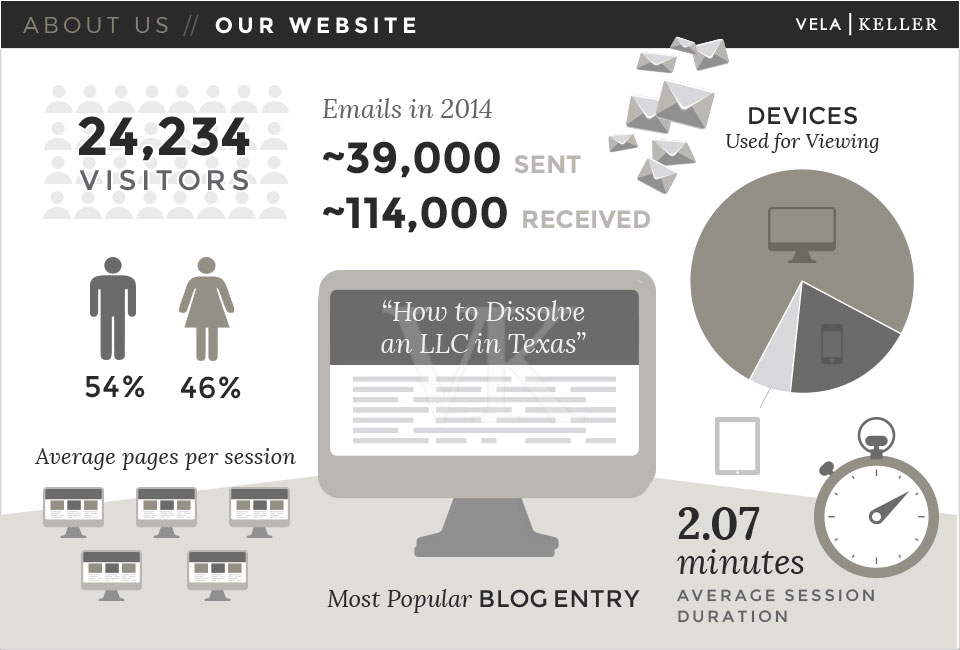
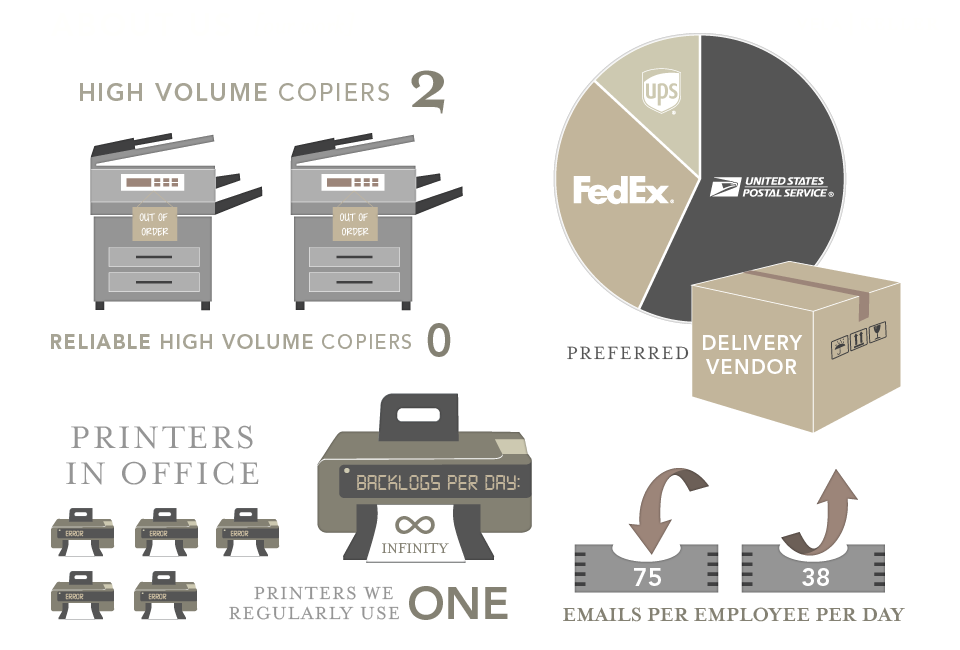
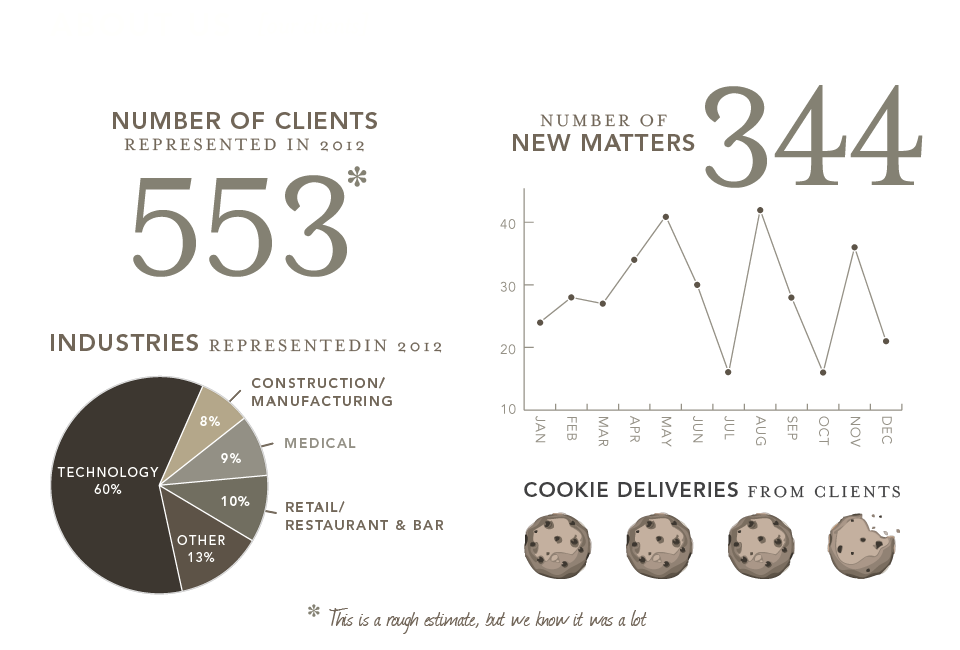
90% of the information transmitted to the brain is visual. 93% of all human communication is non-verbal. Your brain processes images 60,000 times faster than it processes text. If this paragraph were a picture, you’d be done with it by now. At Vela Wood, we love a well-crafted chart or infographic. On this page, you’ll find ours.

VW FWD Impact Report 2023
View Infographic
Vela Wood Fifteen-Year Report
View Infographic
Venture Deals Report 2022
View Infographic
Year in Review 2022
View Infographic
VW FWD Impact Report 2022
View Infographic
Venture Deals Report 2021
View Infographic
Year in Review 2021
View Infographic
Venture Deals Report 2020
View Infographic
VW FWD Impact Report 2021
View Infographic
Year in Review 2020
View Infographic
VW FWD Impact Report 2020
View Infographic
Venture Deals 2016-2019: 4-Year Summary & Trends
View Infographic
Year in Review 2019
View Infographic
Year in Review 2018
View Infographic
Year in Review 2017
View Infographic
Venture Deals 2016
View Infographic
Year in Review 2016
View Infographic
Year in Review 2015
View Infographic
Venture Deals 2015: Seed Stage
View Infographic
Year in Review 2014
View Infographic
Year in Review 2013
View Infographic
Year in Review 2012
View Infographic